Barbosa, Antioquia
Appearance
Barbosa, Antioquia | |
|---|---|
Municipality and town | |
 | |
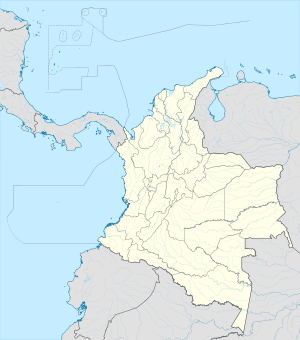
 Location of the municipality and town of Barbosa, Antioquia in the Antioquia Department of Colombia | |
| Coordinates: 6°26′20.4″N 75°19′58.8″W / 6.439000°N 75.333000°W | |
| Country | |
| Department | |
| Area | |
| • Municipality and town | 205.7 km2 (79.4 sq mi) |
| • Urban | 2.79 km2 (1.08 sq mi) |
| Population (2020 est.)[1] | |
| • Municipality and town | 54,347 |
| • Density | 260/km2 (680/sq mi) |
| • Urban | 23,921 |
| • Urban density | 8,600/km2 (22,000/sq mi) |
| Time zone | UTC-5 (Colombia Standard Time) |
| Climate | Af |
Barbosa is a town and municipality in Antioquia Department, Colombia. Situated 39 km from Medellín's downtown, it is one of the municipalities of the Metropolitan Area of the Aburrá Valley. The population was estimated to be 54,347 in 2020. It is known as the Gateway to the Northeast, famous for its lakes and streams. A traditional Pineapple Festival is held here in December and a Train Festival in the district of El Hatillo in August.
Climate
[edit]| Climate data for Barbosa (Progreso El Hda), elevation 1,500 m (4,900 ft), (1981–2010) | |||||||||||||
|---|---|---|---|---|---|---|---|---|---|---|---|---|---|
| Month | Jan | Feb | Mar | Apr | May | Jun | Jul | Aug | Sep | Oct | Nov | Dec | Year |
| Mean daily maximum °C (°F) | 28.1 (82.6) |
28.5 (83.3) |
28.8 (83.8) |
27.8 (82.0) |
28.1 (82.6) |
28.3 (82.9) |
28.3 (82.9) |
28.5 (83.3) |
28.1 (82.6) |
27.2 (81.0) |
27.1 (80.8) |
27.4 (81.3) |
28 (82) |
| Daily mean °C (°F) | 21.9 (71.4) |
22.2 (72.0) |
22.3 (72.1) |
22.1 (71.8) |
22.1 (71.8) |
22.2 (72.0) |
22.1 (71.8) |
22.2 (72.0) |
22.0 (71.6) |
21.7 (71.1) |
21.7 (71.1) |
21.7 (71.1) |
22 (72) |
| Mean daily minimum °C (°F) | 16.1 (61.0) |
16.1 (61.0) |
16.4 (61.5) |
16.9 (62.4) |
17.0 (62.6) |
16.5 (61.7) |
16.0 (60.8) |
16.2 (61.2) |
16.3 (61.3) |
16.5 (61.7) |
16.7 (62.1) |
16.6 (61.9) |
16.4 (61.5) |
| Average precipitation mm (inches) | 57.5 (2.26) |
80.1 (3.15) |
113.2 (4.46) |
188.6 (7.43) |
246.8 (9.72) |
199.1 (7.84) |
207.6 (8.17) |
202.3 (7.96) |
234.2 (9.22) |
235.4 (9.27) |
155.0 (6.10) |
83.3 (3.28) |
2,003 (78.9) |
| Average precipitation days (≥ 1.0 mm) | 8 | 10 | 13 | 20 | 21 | 18 | 19 | 18 | 20 | 22 | 18 | 11 | 193 |
| Average relative humidity (%) | 82 | 81 | 81 | 83 | 84 | 82 | 81 | 81 | 82 | 83 | 83 | 83 | 82 |
| Source: Instituto de Hidrologia Meteorologia y Estudios Ambientales[2] | |||||||||||||
References
[edit]Wikimedia Commons has media related to Barbosa (Antioquia).
- ^ Citypopulation.de Population of Barbosa municipality
- ^ "Promedios Climatológicos 1981–2010" (in Spanish). Instituto de Hidrologia Meteorologia y Estudios Ambientales. Archived from the original on 15 August 2016. Retrieved 3 June 2024.
6°26′20″N 75°19′59″W / 6.439°N 75.333°W


